https://mailchi.mp/ilads.org/member-newsletter-august-687499?e=14b78402e1 Newsletter here


https://mailchi.mp/ilads.org/member-newsletter-august-687499?e=14b78402e1 Newsletter here
https://vitaminmasterclass.com Register Here

For close on 45 years Andrew Saul has been teaching people how to use vitamins instead of drugs. Never was his voice more needed than it is today.
Hear his recommendations for using common every day vitamins to prevent and treat some of today’s most notorious diseases (and viruses!). Andrew does NOT sell or endorse vitamin products, so you can be sure of an honest opinion.
>Online & Free: Starts February 9th<
>>>Register in top link to watch this FREE 7-Part Series<<<
https://www.lymedisease.org/excerpt-chronic-phillips-parish/
By Dorothy Kupcha Leland

Chronic: The Hidden Cause of the Autoimmune Pandemic and How to Get Healthy Again is a long-awaited book by Dr. Steven Phillips and Dana Parish.
The co-authors–a prominent Lyme doctor and a singer/songwriter/advocate who used to be his patient–are well known in the Lyme community. So, it’s initially curious that the book title doesn’t mention the words “Lyme disease.”
But that’s explained early on. In their text, Phillips and Parish use the term “Lyme plus” for the dizzying constellation of microbes that can result in a wide variety of persistent symptoms and autoimmune conditions. Lyme disease (by itself) may be only one part of the complex picture.
Chronic is divided into two main sections. The first part, “The Root,” debunks commonly held myths about Lyme+ and shows how mainstream medicine has so often gotten its facts wrong.
The second part, “The Remedy,” offers practical advice on how to get properly diagnosed and looks at an assortment of treatments that may be useful.
Go to top link to read an excerpt from the book.
This book can be ordered in print, e-book, and audio formats.
https://www.lymedisease.org/cdc-lyme-disease-cases-undercount/
By Lorraine Johnson, JD, MBA
2/2/2021
The Centers for Diseases Control and Prevention recently compared its annual surveillance Lyme numbers [those that meet the agency’s narrowly defined case definition] to the number of Lyme cases tallied in a major insurance claims data base from 2010 to 2018. Their study concludes that the CDC is still undercounting cases1.
But, if you dig deep into the numbers, you see that the undercounting is much more severe in some areas—namely in southern and western states. This has huge implications for Lyme patients in those regions, making it much harder for them to get properly diagnosed and treated.
It’s important that the CDC is acknowledging an extraordinary amount of undercounting and it is also important that they are looking at other big data sources (here insurance claims) to see how far off the mark they are. However, the degree to which the CDC surveillance system undercounts cases is not equally distributed geographically. States that are considered low incidence states are disproportionately undercounted.
Here’s a table comparing the amount of underreporting reflected in the reduced number of surveillance cases compared to insurance claims in the CDC study in high-incidence, neighboring states, and low-incidence states:
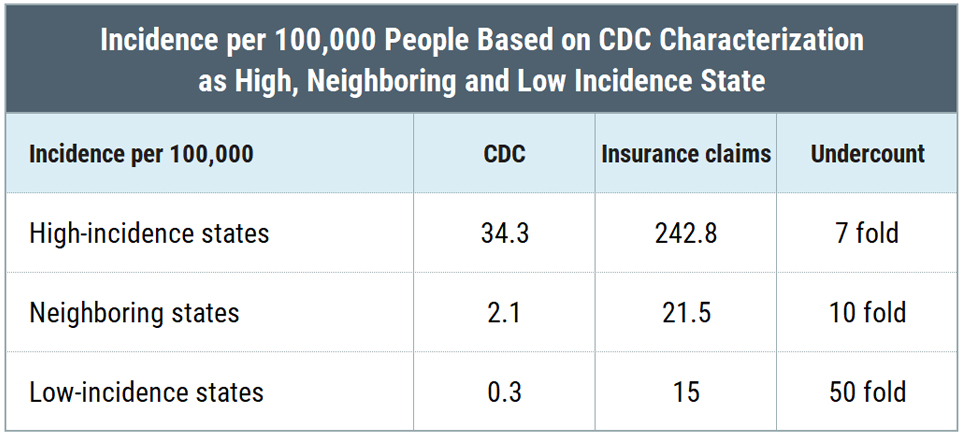
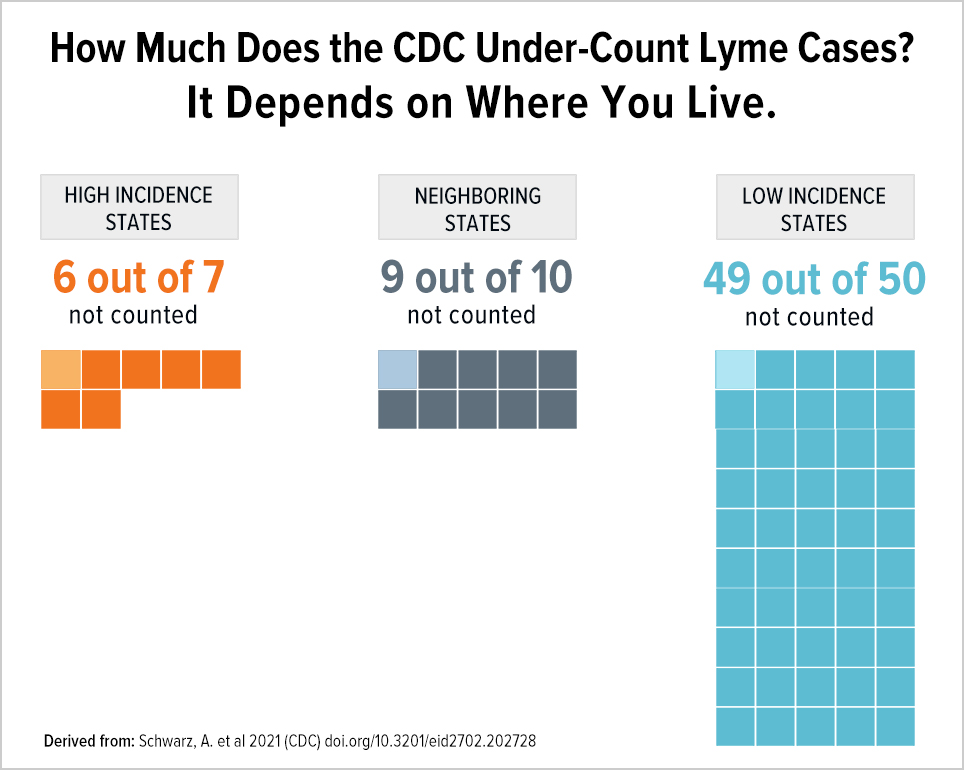
What we see is that the undercount is not equal among the three categories: high-incidence states are undercounted by a factor of 7, neighboring states by a factor of 10, and low-incidence states by a factor of 50. Undercounting cases by a factor of 50 means that for every single case identified, the CDC throws out another 49 cases. Thus, the CDC geographic case restriction impairs accurate counting of cases.
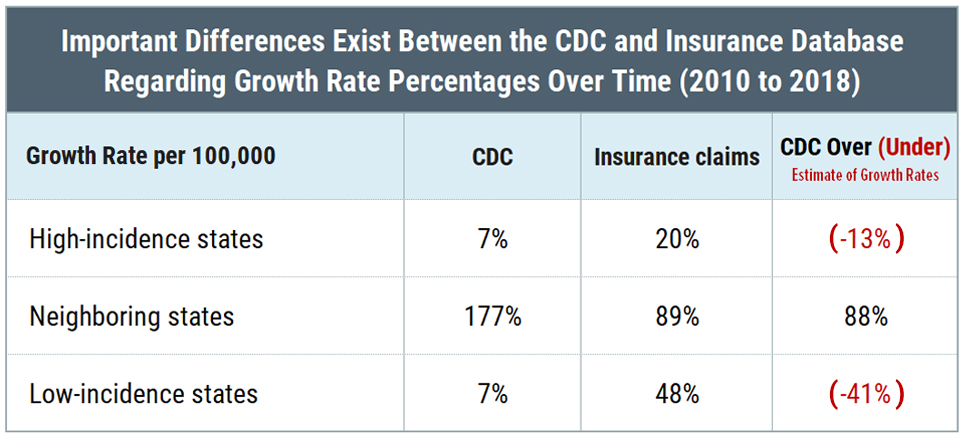
Moreover, the percentage of increase in cases reported by the CDC compared to insurance claims data shows the same anomalies among the different categories of states.
The CDC surveillance counts place a heavy emphasis on “high incidence” states—which are primarily confined to the East Coast and Midwest as the map below illustrates.
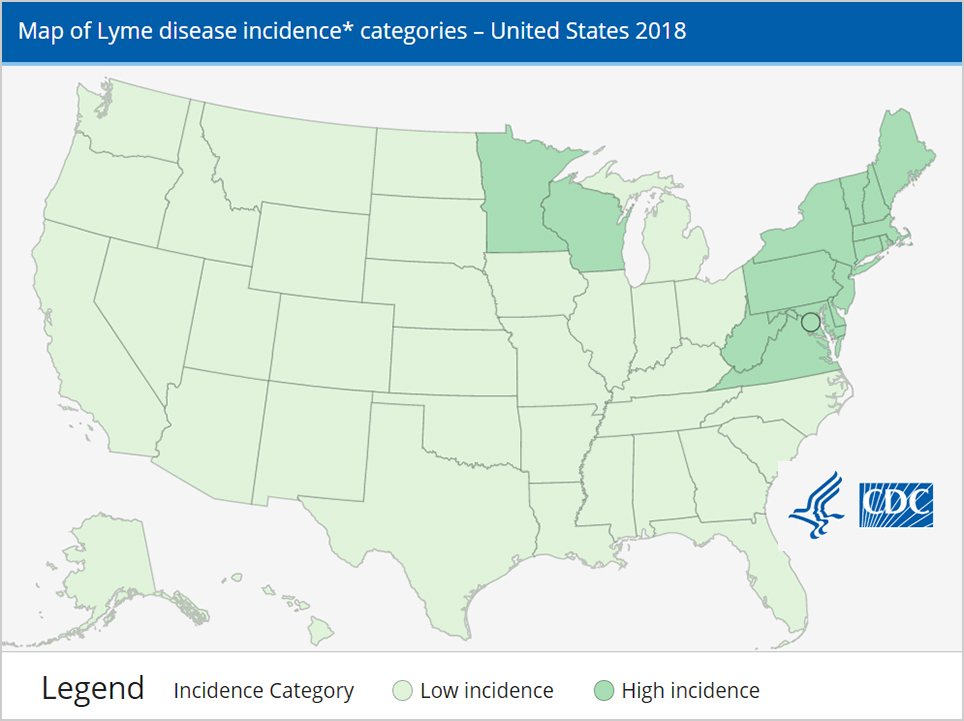
Unfortunately, saying that a state is either high or low incidence oversimplifies the complex geographic distribution which is driven by whether the local ecosystem will support and sustain the tick population that carries Lyme disease. In California, for example, there are areas as highly endemic as the east coast. The CDC totally ignores such variation within a single state. This emphasis on high incidence states is not only inaccurate, it also leads to misdiagnosis in other states where clinicians are led to believe the risk is not present. The feedback loop is further distorted because the CDC case report form includes endemicity as a requirement for counting cases, which in turn reflects awareness of risk, physician diagnosis, and counting of future cases. This misleading feedback loop will artificially suppress case counts in areas outside the Northeast and Midwest in perpetuity until it is abandoned.
For years, the Lyme community’s complaints about misdiagnosis by geography have fallen on deaf ears. Although the study increased the number of cases by 58% with the new 476,000 estimate, it also demonstrates how much cases in low incidence states are under-counted compared to high incidence states when different data sources are compared.
So for example, while surveillance data shows 93.2% of cases in high-incidence states, insurance data shows only 80.5%. That’s a 12% difference and it matters. It means that the CDC is undercounting cases in states that it does not characterize as high-incidence. We know this is likely true because another insurance data base study showed many states the CDC considers to be low incidence states to be in the top five states in insurance claims.
As reported in the Wall Street Journal: “North Carolina reported 32 Lyme cases to the CDC in 2016 but in the same year made 88,539 health-care claims for a Lyme diagnosis. California reported 90 cases to the CDC but had 46,820 claims. Texas reported 31 cases to the CDC but had 31,129 claims. All three are considered low incidence states 2”.
We also see this in the differences between MyLymeData geographical distribution of cases compared to the CDC below. The states in blue have a higher number of people enrolled in MyLymeData than are included in total CDC Lyme disease case reports. (In green states, the CDC has more cases.) The differences reflected on the map suggest a broad pattern of underreporting by the CDC of Lyme disease in the South and the West.
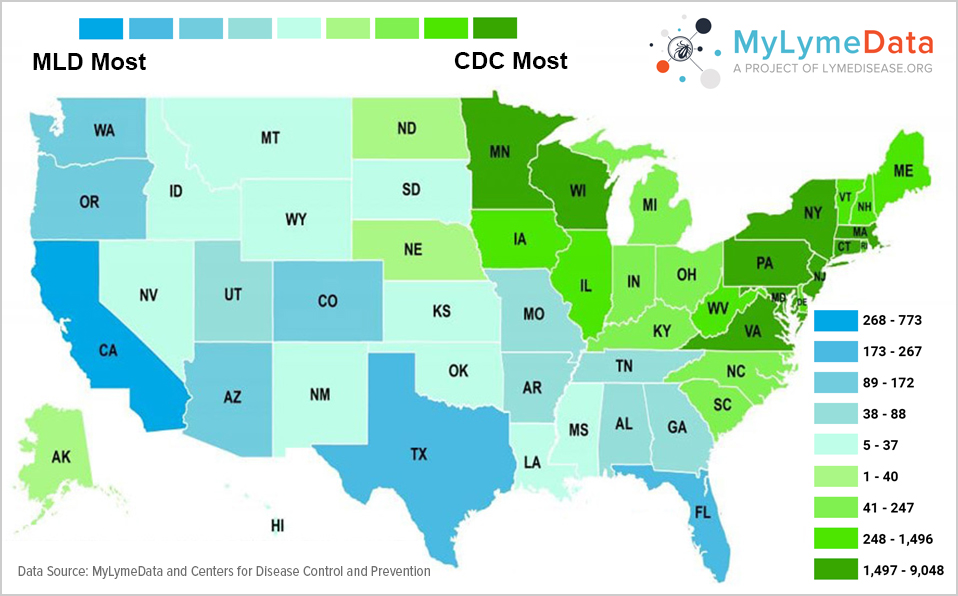
If the CDC is going to look at real word data, it should be willing to consider that its preconceived notions of geographical distribution are incorrect and “listen to the data.”
A similar variation in seasonality occurred. A higher proportion from high-incidence states (59%) occurred during the summer compared with diagnoses from neighboring (53%) and low-incidence states (42%). This may reflect the warmer weather in the west and southwest and an extended tick season.
Distributions by sex also differed across high-incidence, neighboring, and low-incidence states. Male patients accounted for a greater proportion of diagnoses in high-incidence states (50.8%) than in neighboring (41.9%) and low-incidence (36.6%) states. Biodiversity of strains and ticks across different ecosystems may affect males and females differently. But the fact that 63% of cases in low incidence states are female underscores the fact that gender-based assumptions may not accurately reflect the real world data. We do not know.
The increase should be viewed as part of an effort by the CDC to find other ways of tracking Lyme cases because the current surveillance system is essentially broken. The current surveillance system imposes too great a burden on healthcare providers and on the local departments of health. As a result, cases are simply not reported. Streamlining this process by using either automated laboratory results or insurance claims from sources that already exist would dramatically reduce these burdens and hopefully more accurately reflect cases that occur in the real world.
Significantly, the new CDC study concludes that the MarketScan insurance claims data they used “provided a stable source of data for . . . diagnosis. . .that could serve as a resource efficient adjunct to surveillance.”.
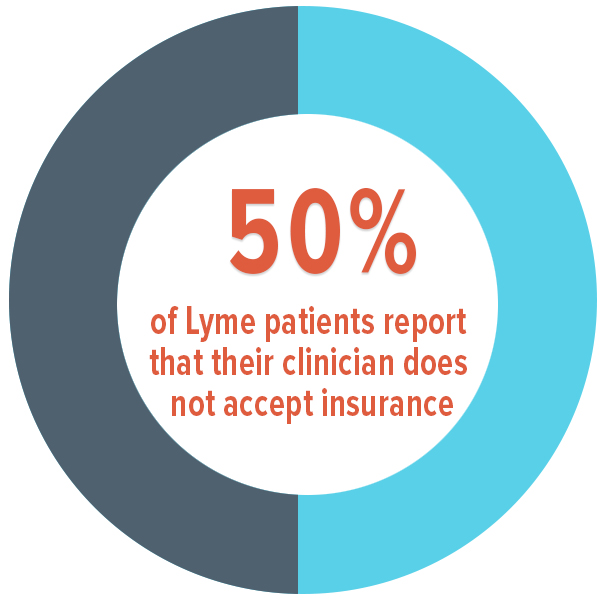
The CDC’s increased estimate based on it’s comparison of real world insurance claims data to surveillance data is important. Even this increase widely misses the mark though. MyLymeData tells us that 50% of patient report that their clinician does not accept insurance. Those patients may not be included in the insurance data base.
I am also bothered by the fact that when the geographic real-world data differs from the surveillance data, the CDC assumes that the real world data is wrong—that it’s due to miscoding or misdiagnosis. Why not consider the possibility that the CDC’s surveillance data could be incorrect? That independent data sources may provide us with a look at a larger reality and geographic and gender-based difference that require a deeper examination?
Even with the increased CDC estimate in Lyme disease cases, patients in the south and west will continue to be harmed by delayed and missed diagnosis because of the weight the CDC places on geography in the surveillance case reporting.
We know that the surveillance data is skewed because it has inherent biases for cases that present with a rash and for cases that are geographically on the East coast or Midwest. Both of these factors play a large role in meeting the requirements of the surveillance case definition. Even with the increased estimate in cases, patients in the south and west will continue to be harmed by delayed and missed diagnosis because of the weight the CDC places on geography in the surveillance case reporting.
It’s good news that the CDC has increased its estimate of the annual number of cases after seeing that they are well below insurance claims cases. It would be better if they overhauled their surveillance case definition so that reporters don’t use these drastically under counted cases in their news articles and physicians are given the tools to promptly diagnose patients.
If you are a patient who is not enrolled in MyLymeData, please enroll today. If you are a researcher who wants to collaborate with us, please contact me directly.
The MyLymeData Viz Blog is written by Lorraine Johnson, JD, MBA, who is the Chief Executive Officer of LymeDisease.org. You can contact her at lbjohnson@lymedisease.org. On Twitter, follow her @lymepolicywonk. If you have not signed up for our patient-centered big data project, MyLymeData, please register now.
https://upvir.al/ref/NU52390065 Register Here
Finally, it’s almost time to get some sensible, REAL, and honest truth about C0V!D and the “shot”…
Tonight we peel back the wrapping on the most significant power grab in health — perhaps in the history of the world.
If you’ve been worried, confused, or even angry, this is for you.
It’s time for answers, AND WE’VE GOT LOTS OF THEM FOR YOU.
Rest assured, they start coming out in a big way, starting tomorrow.
You will receive personal viewing links tomorrow as soon as the first episode goes live.
Want your family and friends to join in with you, perhaps have a virtual viewing party? Forward this email along so they can register as well.
Your free registration gets you answers
With Purpose,
Dr. Patrick Gentempo
You will have 24 hours to view each one of the 9 episodes.


MyLymeData is one of the largest patient-driven registries in the nation, with over 13,500 patients enrolled. It was created by patients, is run by patients and will address the issues that Lyme disease patients care about. MyLymeData Viz provides the community with results from MyLymeData. If you are enrolled in MyLymeData, we thank you for providing the data that will accelerate the pace of research in Lyme disease. If you are not enrolled, please enroll today.